

Alerts was a feature which was specially requested by the users. Our users asked for a system where they would get a notification when the price would hit a certain price point. As a business bringing users back into the product and retaining them is always the top priority. Notifications are highly effective for this, specially in a case where the notifications are user generated.Similar feature was already available on our competitor’s platform. To have the competitive advantage and to provide additional value to our users we needed a powerful version of this alerts.Image: price hitting a point and notification is sent.
UI/UX, Research [Desk Research(Competitive Analysis), Qualitative (Internal users)], Complete Product Design end to end.Since there was no Product Manager at this point a CoinDCX, I was continuously bouncing of Ideas and the deciding the scope with the CTO.
Initially competitive research was undertaken to understand various trading exchange's on how they handled user generated alerts. This research was carried out across both the stock and crypto trading industry. In the research it was found some platforms(mostly stock market platforms) had dedicated products just for this feature. This products not only had alert for last traded price, but also for volume, 24hr change, OHLC prices of charts and more. In the qualitative research, a requirement to add a note(similar to one of the stock trading platform) for the alert came forward. After this initial research was conducted, this new information was synthesised. In the moment of serendipity the very core problem was revealed.
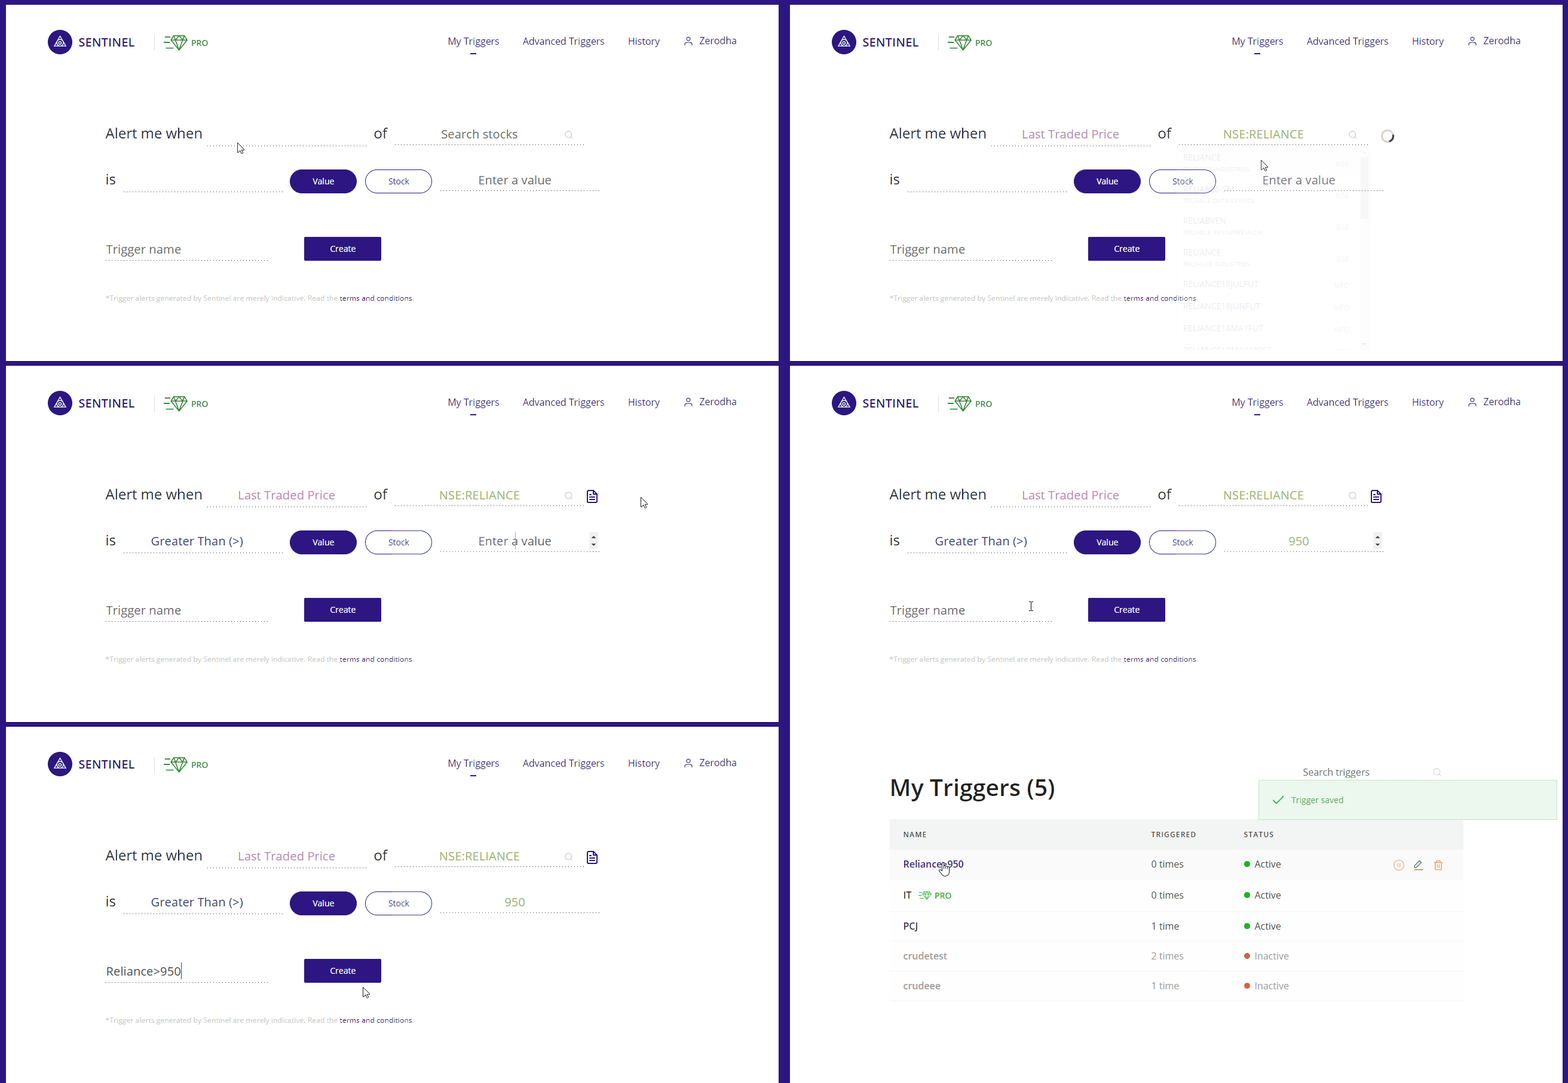
User had requested a feature to create a price alert, so that they can come back into the platform at a time when that trading pair was at a desired price. I realised that users have this "fear of missing out (FOMO)" of their desired market conditions. They real want to be in control and be ready for the market conditions. Understanding this very core, where most alerts were created for potential entry and exit in the market, helped us in realising the all the possibilities and the scope of this project.
This led to research on all the possible factors on which a users takes an entry or exit in the market. This qualitative research was done by understanding how the internal users(CoinDCX employees) took entry or exit in the market. The analysis which user undertake can be categorised into two parts viz. fundamental and technical.

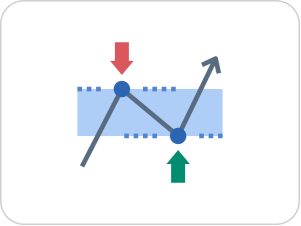

Alerts on price and volume were not new. And though they created value for the user, we needed something more. After price and volume I turned out attention to technical indicators.Technical Indicators are mathematical calculations which help predict the future trend based on the past and current values of the trading pair. Both qualitative and quantitate research were carried out for understanding technical indicators. The qualitative research carried out was within the internal trading team to learn on how they used this technical indicators. One of the most insightful discovery was when our CA Karan Kammdar was interviewed, on how he used the indicators.
So to give the context, indicators can be broadly divided into different categories. One of this category is moving averages. In this category there many types of indicators. For now we are going to look only at three of of this:
In the interview it was discovered that Karan used two moving averages. One with large data set and one with small data (the length of data set was custom set by him). He used this for two separate indicators for a function which could be achieved with just one single indicator of "moving average crossover". Upon inquiring why of this, it was discovered that because "Moving Average Crossover" used EMA's for calculations which were very much sensitive to current prices he didn't want to use it. From the overall qualitative interviews, it was discovered that:
The quantitative Research was carried out in two parts:
Now creating technical indicator alerts would not work the same as way as creating alerts for price. Indicators are designed to work along with charts. To get a alert for an indicator there should be an irregular event that occurs. Not all indicators work in this fashion. As a results again exploratory research was carried to study and understand the indicators which were short listed. This led to complete understanding of the indicators, right from how they are calculated to what and how they convey the entry/exit signals and what parameters can be user editable. Because of this research I was able to further short list the indicators to test.
Still calculation of this indicators for different time periods continuously would utilise a lot of resources on the server side. And we didn't even know how many users will use this new feature. Therefore it was decided that this calculations would only start when a request for it is created by the user.
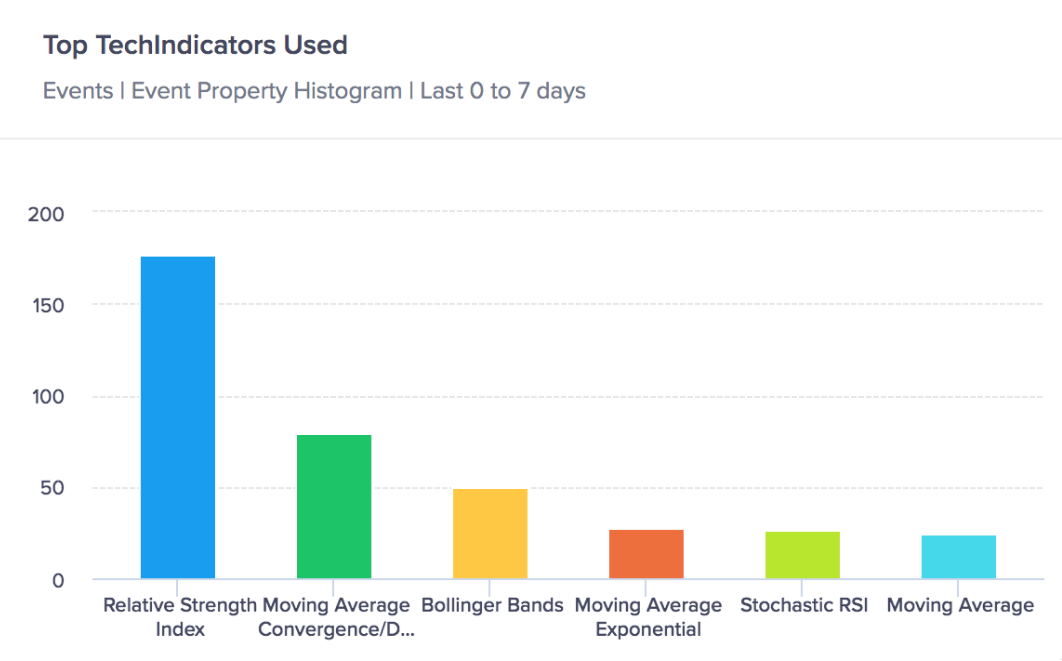
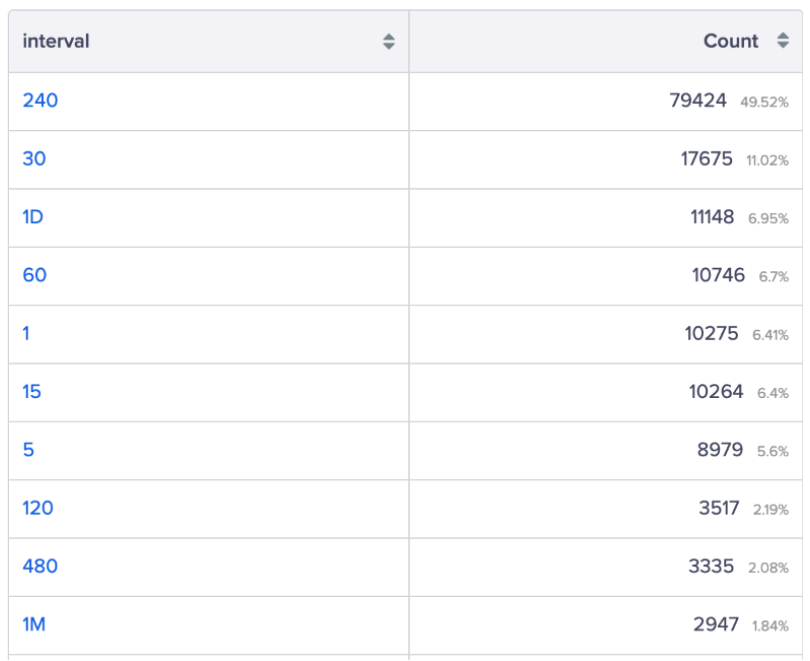
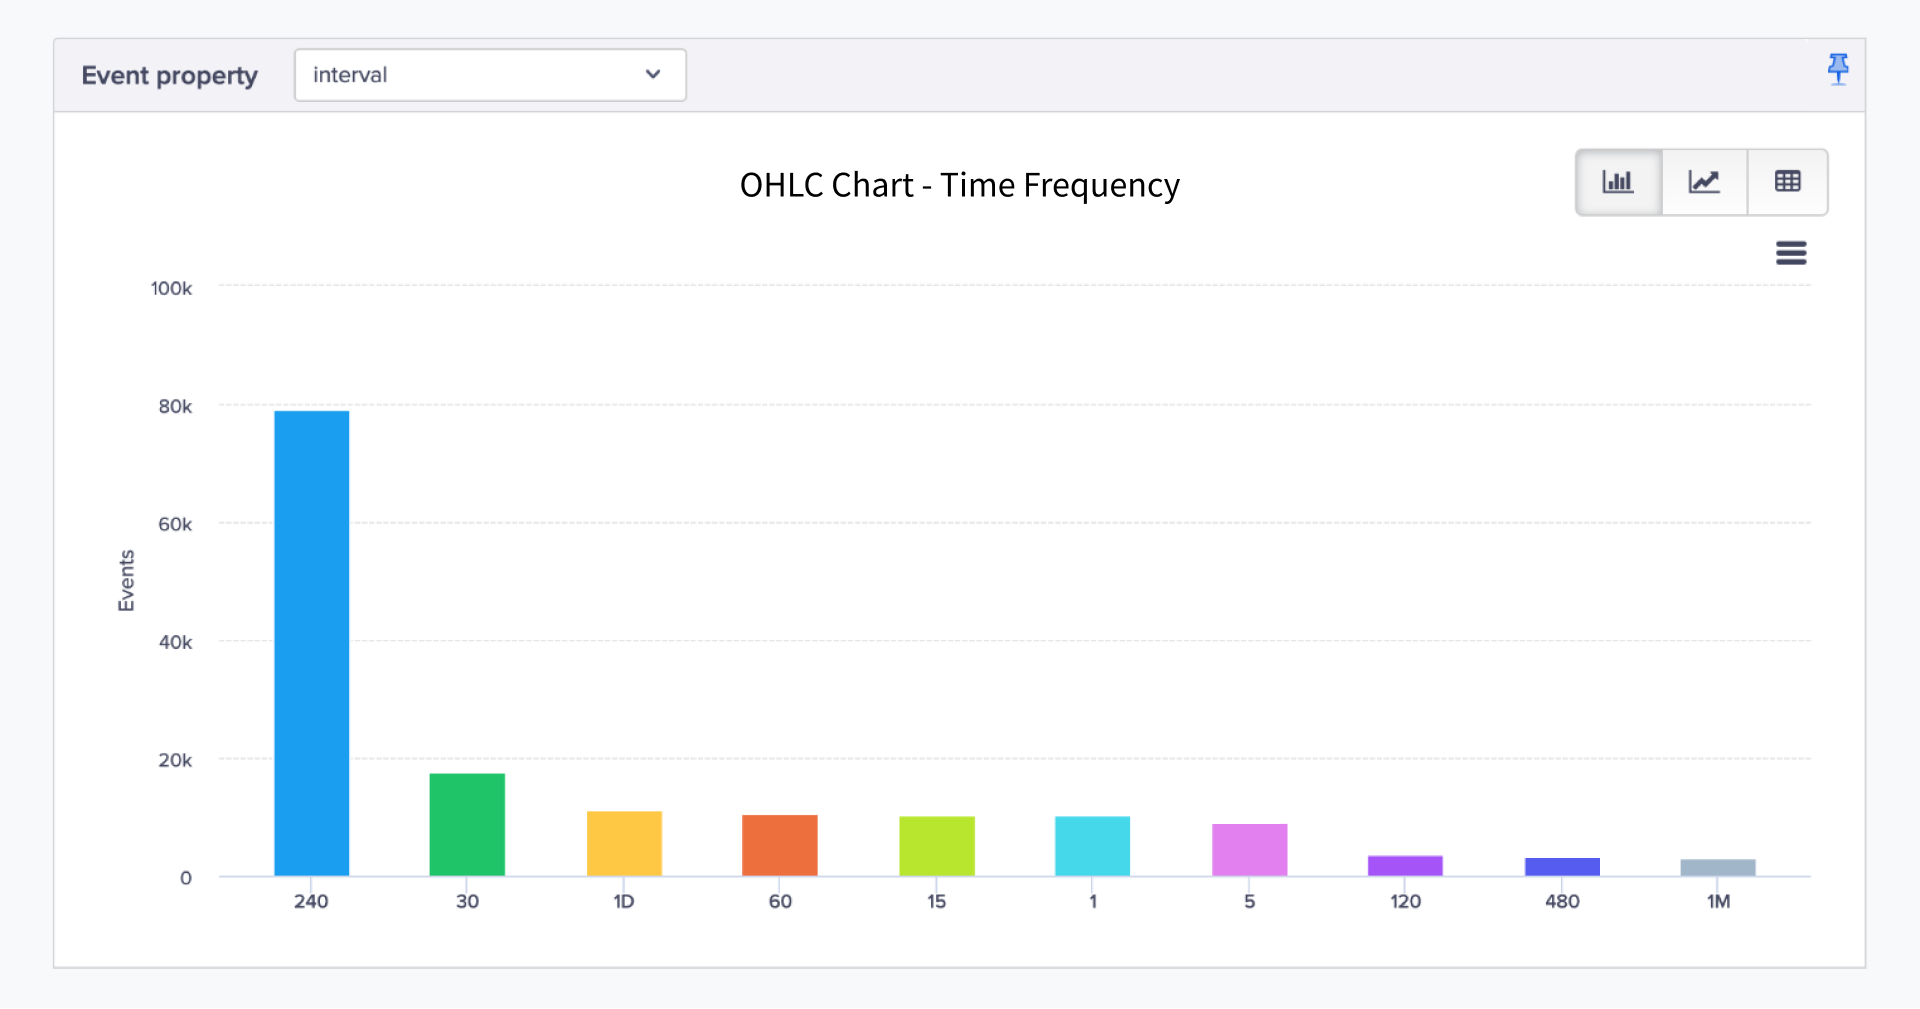
Most users (~95%) use the same industry standard indicators, which have been used for technical analysis for decades, but some users create their own indicators, based on their own strategies and mathematics. MA (Moving Average) takes into consideration the previous set of data for which the calculations are made. The length of the data set can be changed by the user. Further, each of this data comes from the time period which is selected by the user.
Calculating this data for each of the 500+ trading pairs which further had 10+ time periods was not very cost effective. Now add the factor that users want to change the constant values in the indicators calculations. The effort to value ratio for this was really low, as this was going to be industry first feature and therefore a experiment. As a result it was decided that for technical indicator alerts we will first test it out with only 5-6 indicators. The data from CleverTap was used for short listing the the indicators
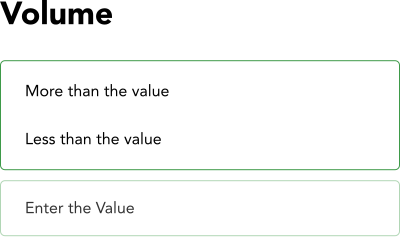
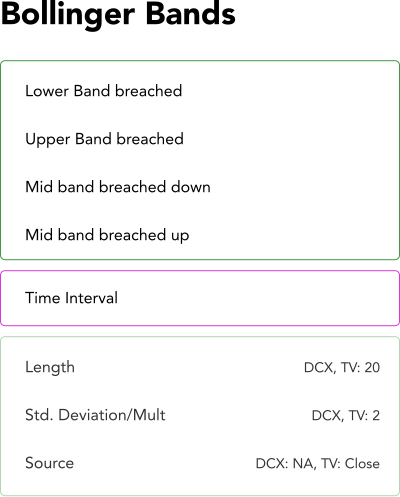
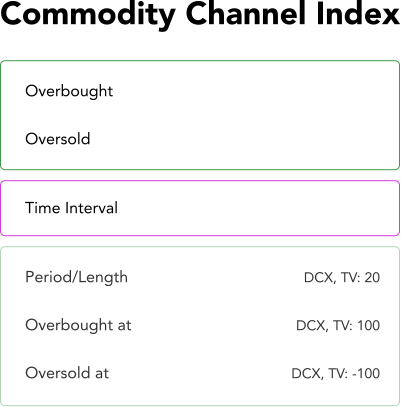
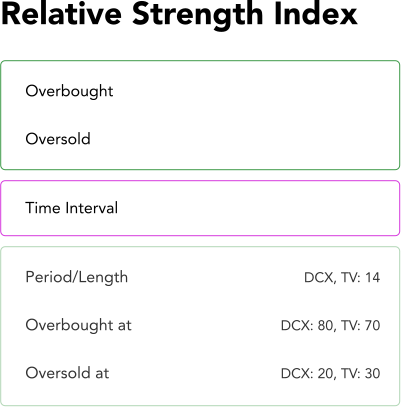
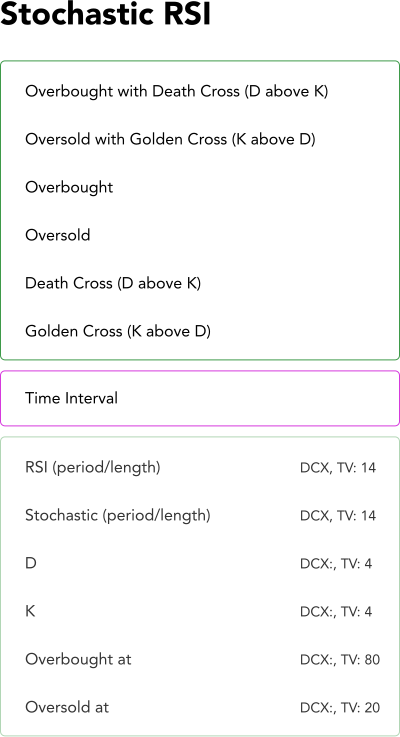
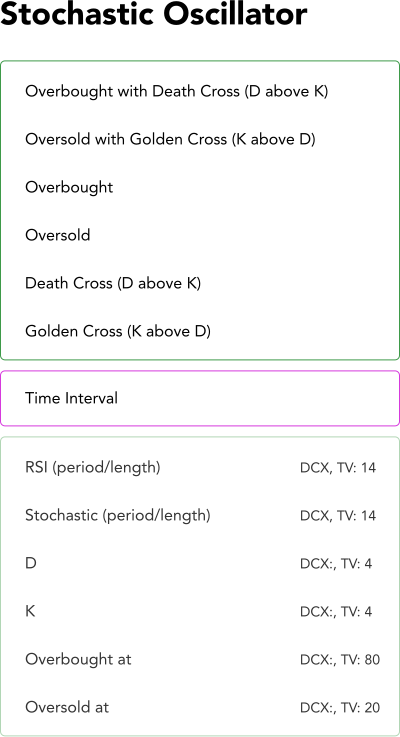
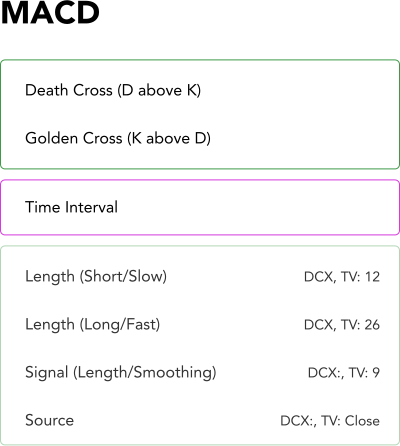
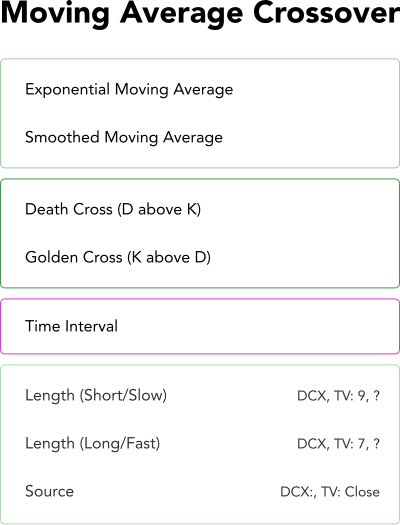
Finally it was decided that user will have the following signals to report to:
Data Points for each Technical Indicator
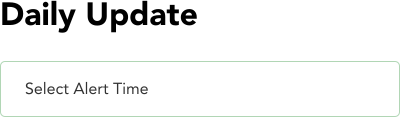
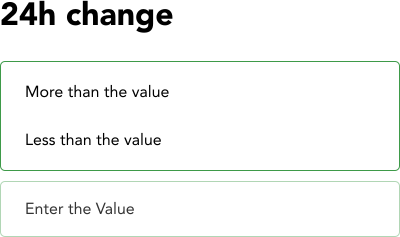
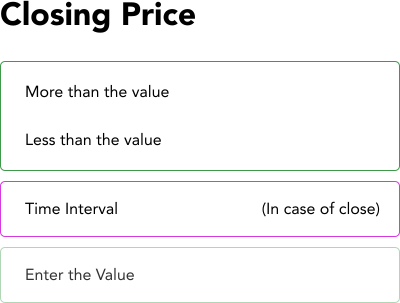
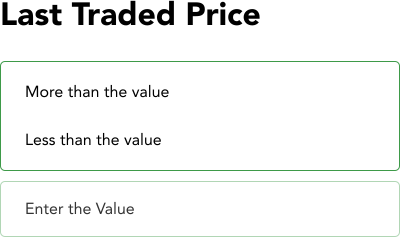
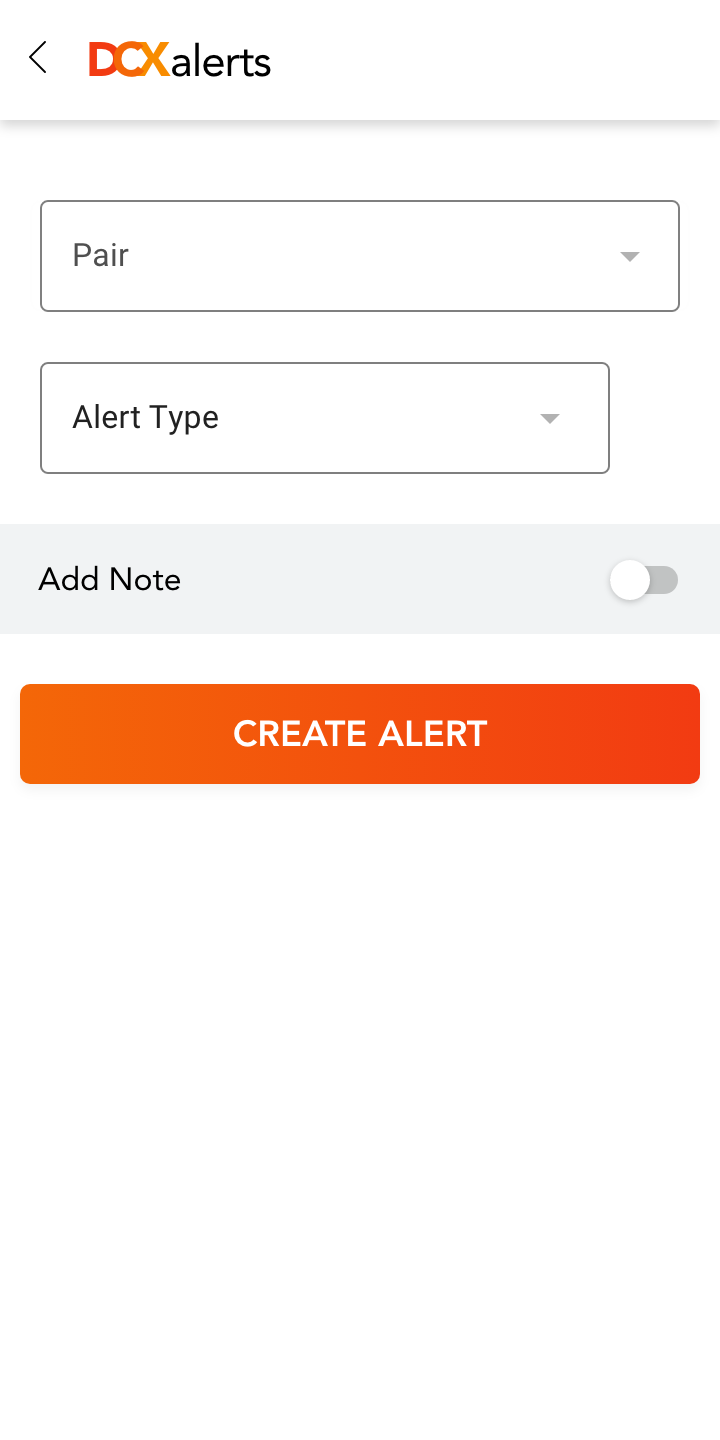
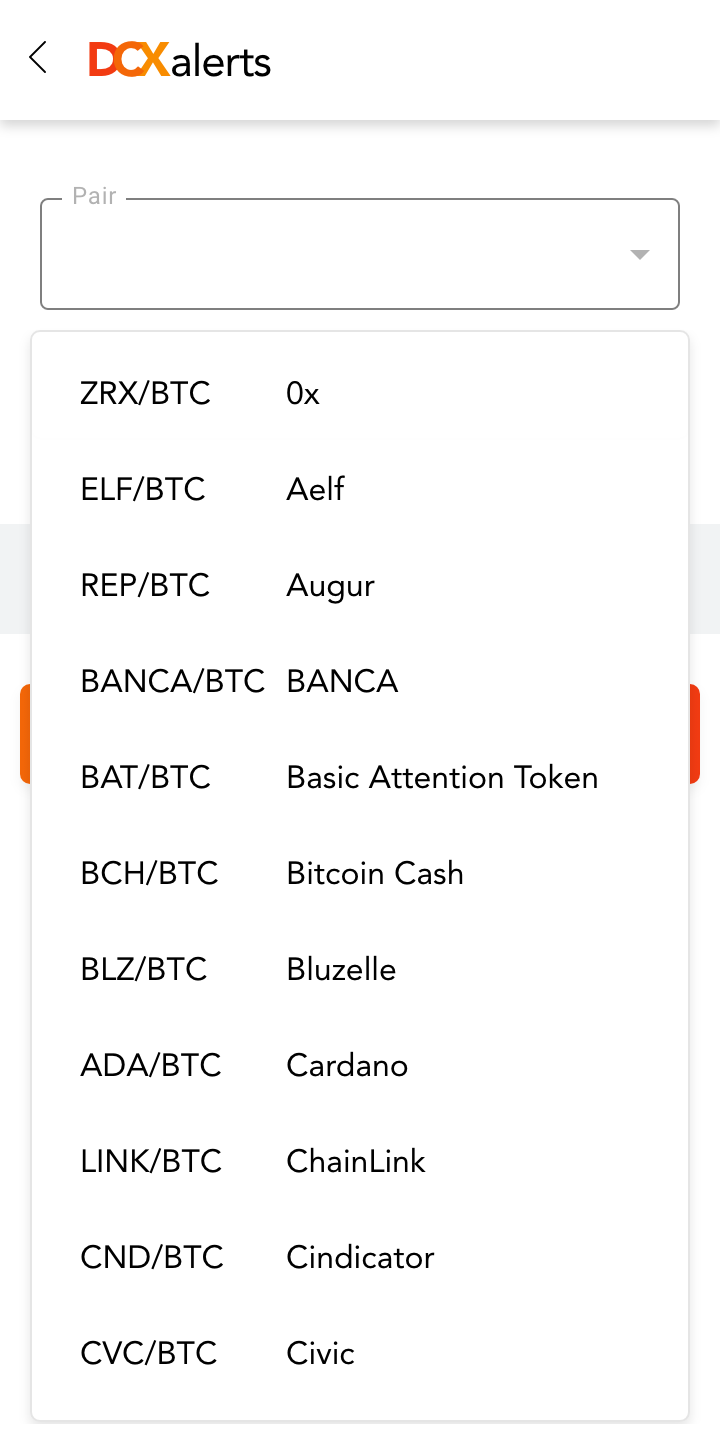
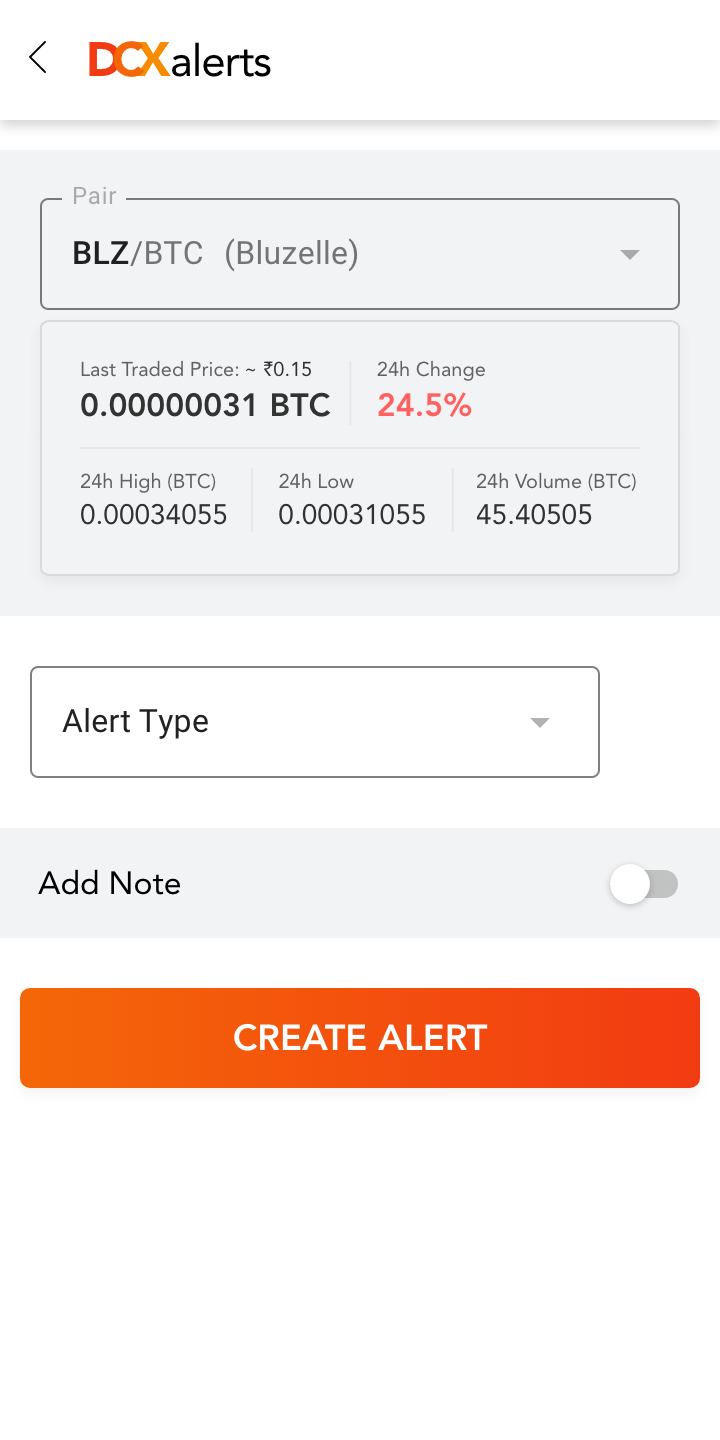
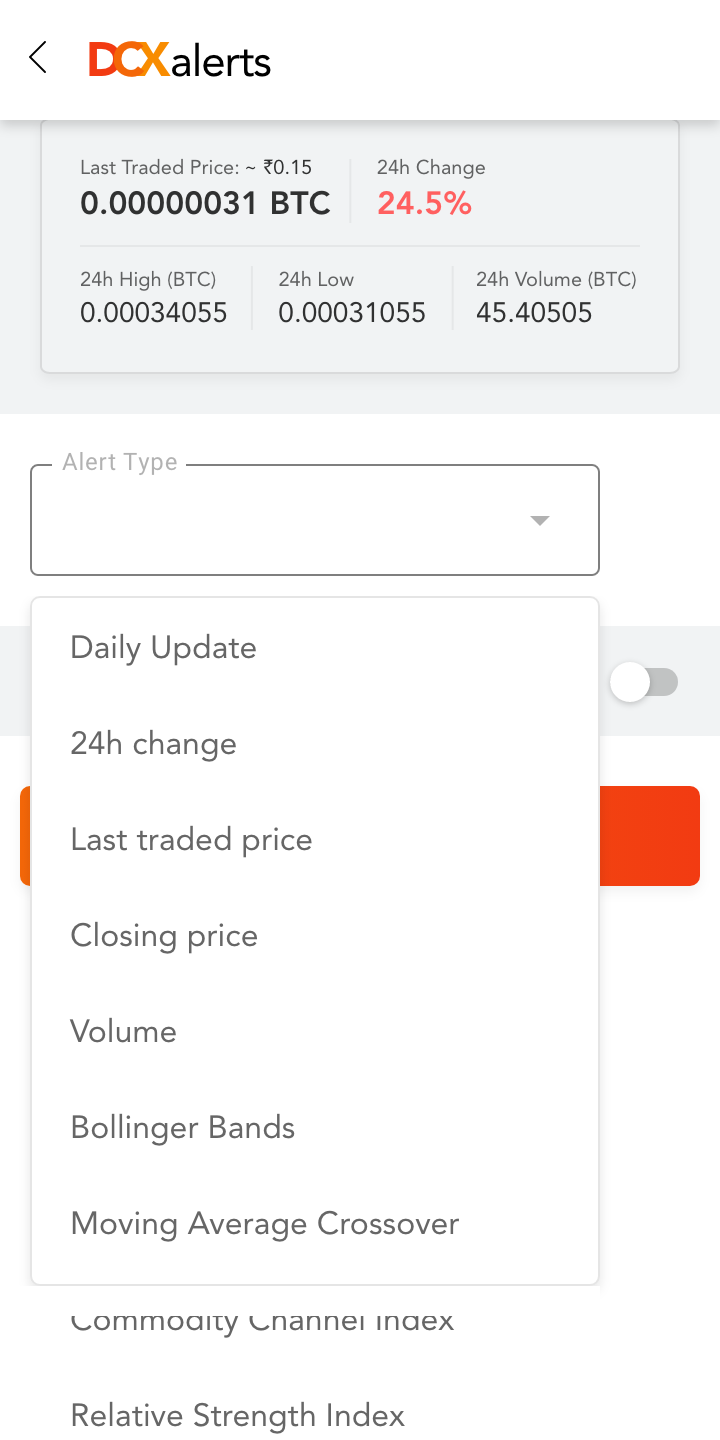
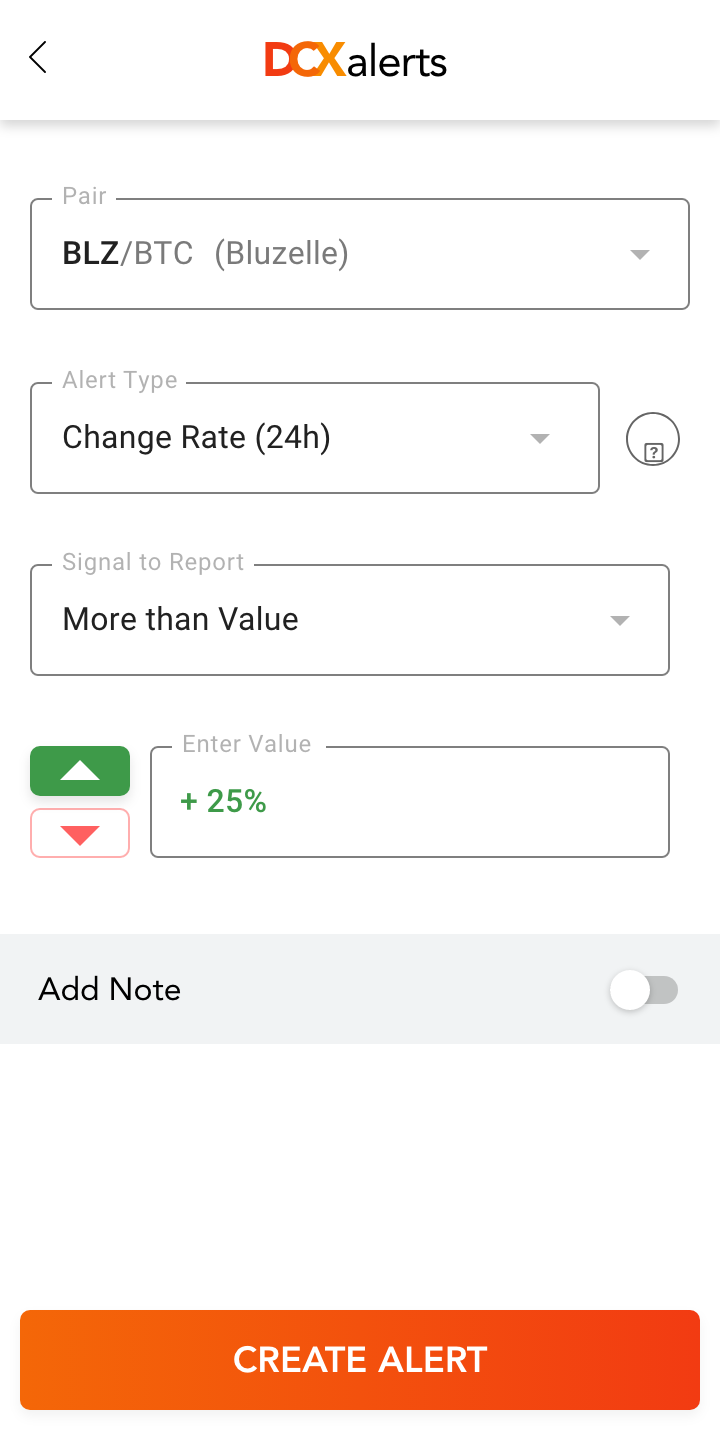
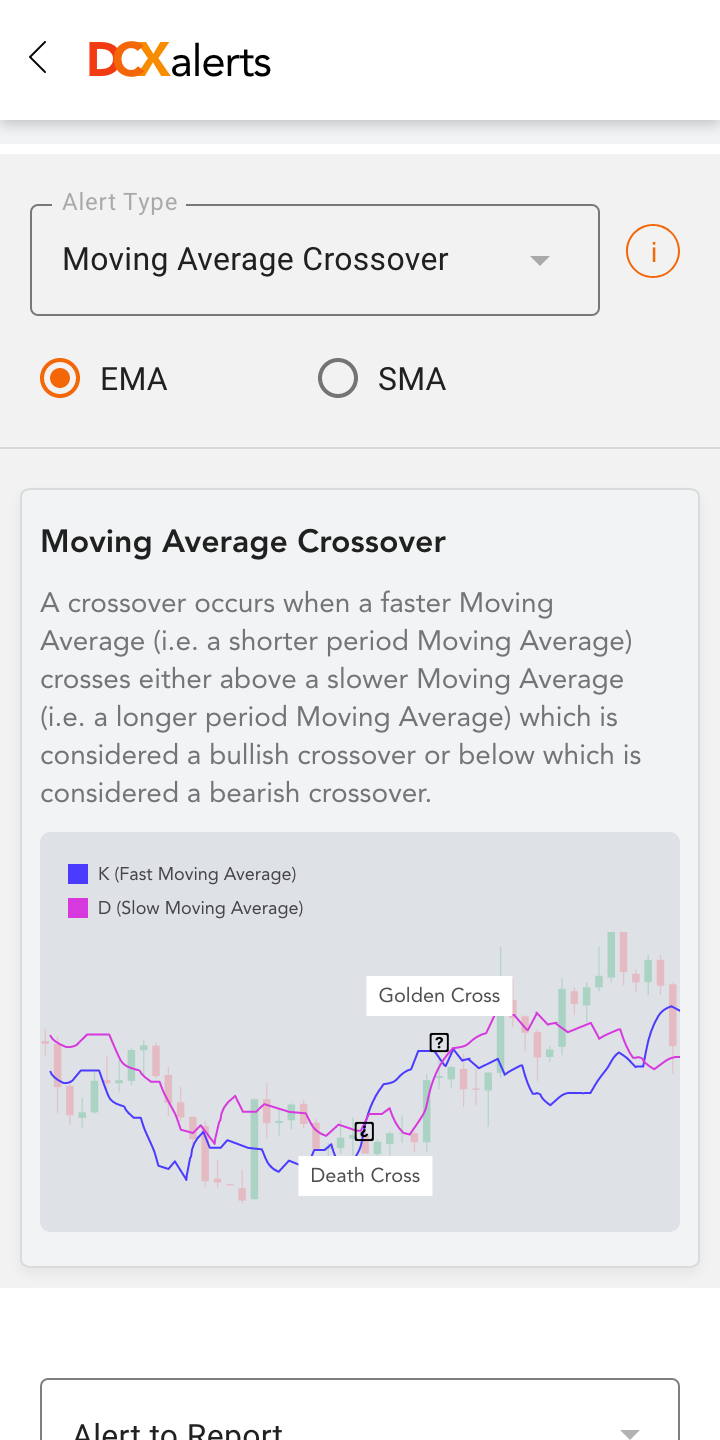
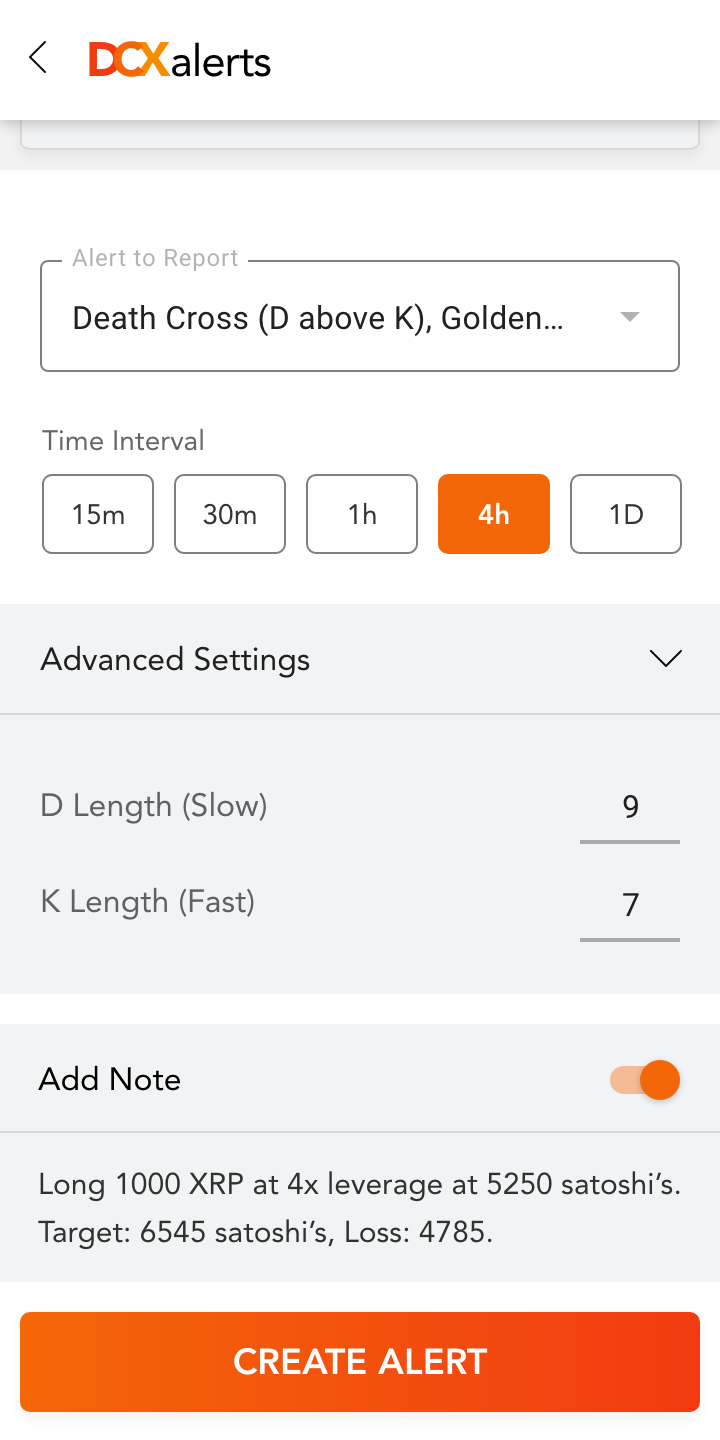
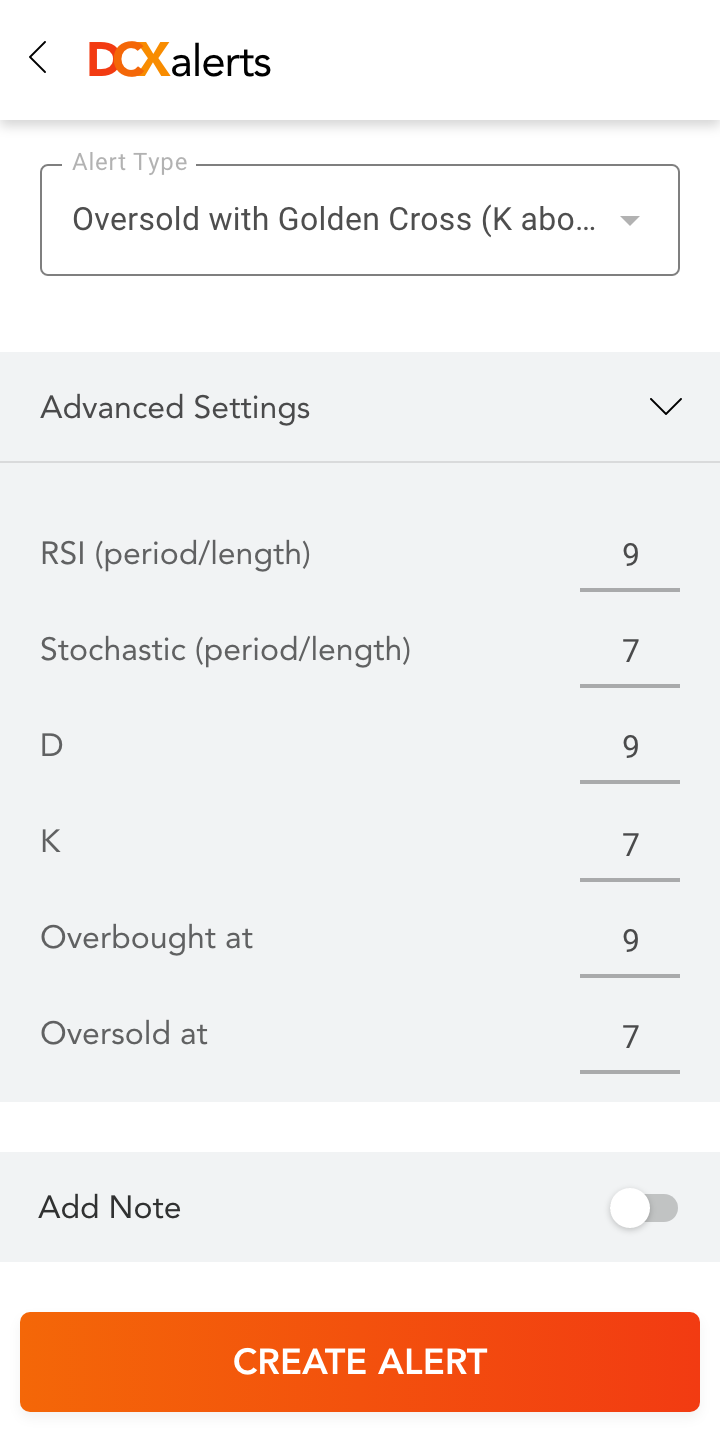

Even though everything was planned, researched, designed and prioritised; alerts didn't go in to production. This was because more important tasks had come up (DCXfutures and redesign of mobile app). Only basic Price Alerts were pushed into production.
In the future this advanced alerts are planned to go into production. Understanding that users relied on technical indicators for potential entry and exit in the market was really important. This meant that in the future technical indicator could be used as triggers for placing a entry or exit in the market. Algo trading can use technical indicators for triggers. Also this technical indictors can be used for selecting a trading pair based on what technical analysis says for the available indicators. This can be done by defining a range for each indicator which conveys either buy or sell, and then based on which side majority of available indicators point, a clear of either buy or sell can be conveyed to the user for that trading pair. The range can be from from strong buy to strong sell, something similar to which is provided by "Trading View".
CoinDCX
Product Designer
Read more about my work at CoinDCX